Monitoring spending
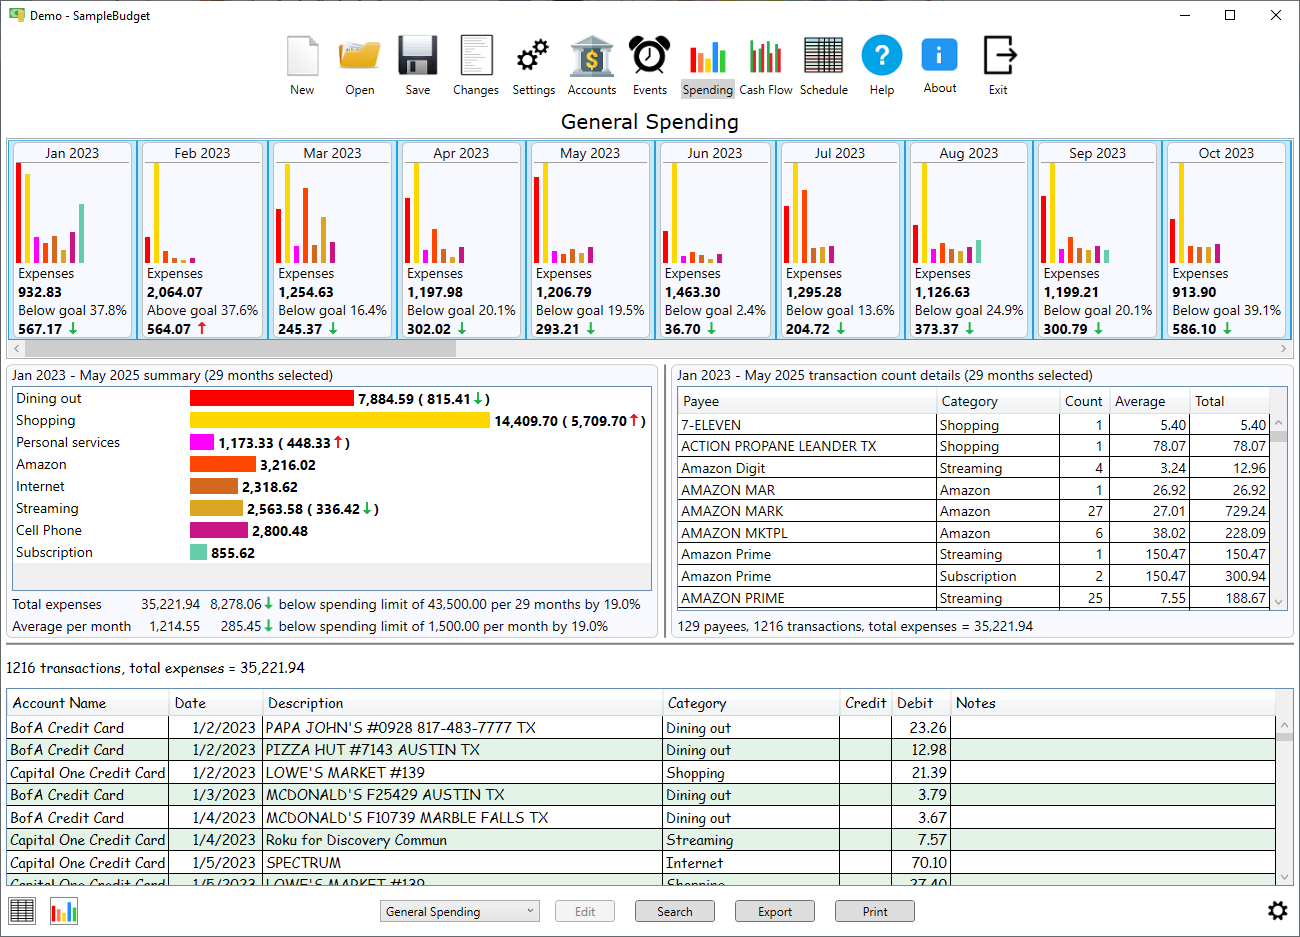
Spending is monitored on the spending page. Click on the "Spending" icon in the main menu at the top to go to the spending page. There are two different views for spending. One is a spreadsheet view with the results displayed in a grid where each row is a category and each column is a month. The other is a more powerful bar chart view with spending broken up into selectable intervals where each interval is a mini bar chart of spending by category for that interval plus some statistics.
The bar chart view displays spending with bar charts. At the top of the page is a horizontal list of selectable spending intervals. Each interval shows a mini bar chart of spending by category for that interval plus some statistics. Below that are summary statistics by category and payee. The payee is automatically extracted from the transaction description. The associated transactions are shown at the bottom of the page. Any of the spending intervals or statistics can be selected to narrow the analysis.
Click on the Options icon to set the analysis mode, select categories or spending groups, set interval length (month, quarter or
year) or display options. Click the
 icon for additional actions.
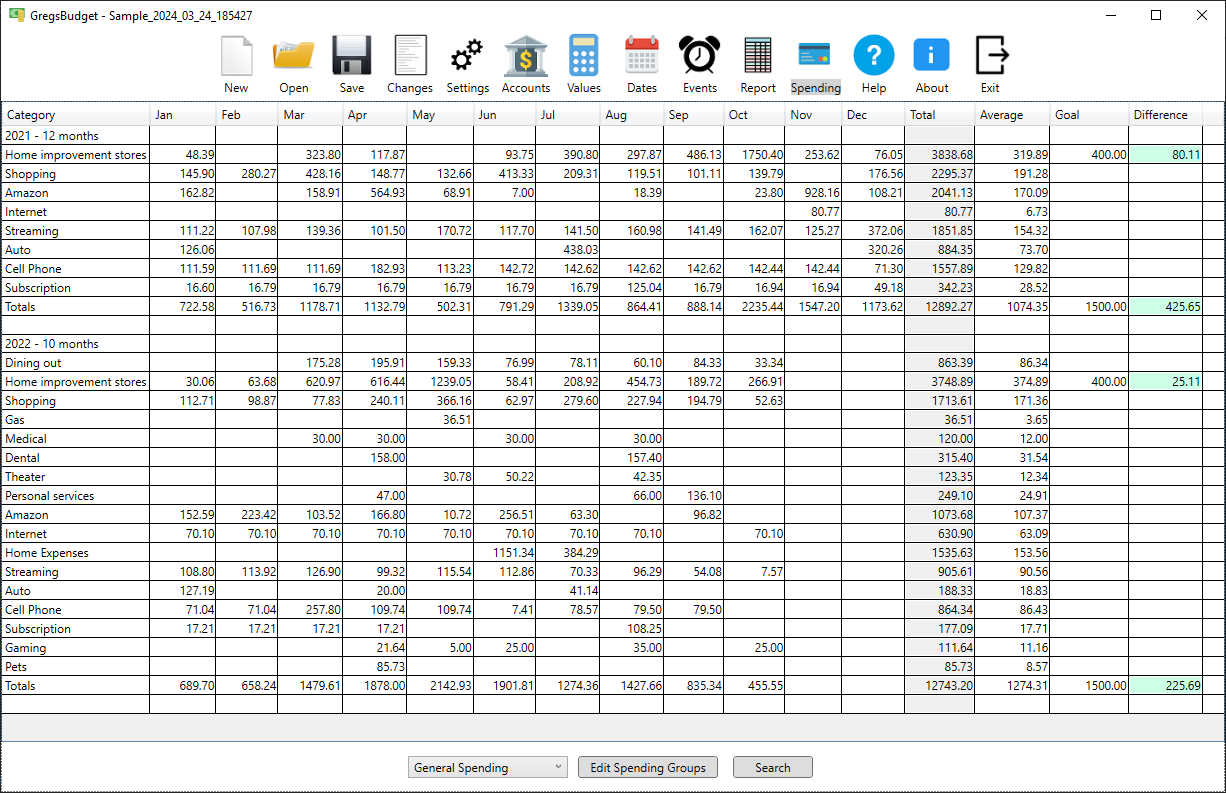
The spreadsheet view sums up the transaction amounts by year, month and category. These sums are shown in a grid, grouped by year, with each month in a column and each category in a row. There are additional columns for the total of all months, the average, the monthly goal for that category (if given) and the difference between the goal and the average. An additional row shows the total of all categories for each month, total of all categories for all months and an average monthly spending across all categories.
Click on the Options icon to set the time span, analysis mode, select categories or spending groups or display options. Click the
icon for additional actions.
Transactions for one or more selected categories can be seen by clicking the "Search" button. The "Search Transactions" window allows the transactions to be searched by date, amount or text in the transaction description or notes. The results are shown and a total number of transactions and a sum of those transactions is shown in the lower left. The transactions can be exported to a CSV file or printed out.
In the example below a search term of "Roku" was searched but you could also search for an amount or specific date.
Here is an example where a search for an amount was done.