GregsBudget
for Windows
Features
- Multiple profiles - Create a profile for yourself and for anyone else that uses your computer
- Bill tracking - The schedule page tells you what bill is coming up due (never be late on a bill)
- Simple payments - Mark bills paid as you pay them (just check it off on the schedule)
- Budgeting - Set goals for spending in different categories and check your progress
- Record keeping - Keeps a record of every transaction in any account you choose
- Tax planning - Automatically sets aside money for taxes when drawing on tax deferred accounts
- Budget forecasting - See where you will be years into the future
- Wealth tracking - See your current or future net worth at a glance
- Retirement planning - Check how your retirement plans are going
- Smart transfers - Automatic calculation of required withdrawals for future expenses
- Reminders - Set reminders for anything
- What-if - Change dates, amounts, and events with a click of the mouse and see how the budget is affected
Privacy
- No ads
- No tracking
- Uses your Windows login so no user name or password required
- No internet connection required after install
- All data stored locally on your hard drive
GregsBudget
- One low price of $29.99
- No subscription fees
- No in-app purchases
- Get it from the Microsoft Store
GregsBudget Demo
- Free
- Maximum 5 accounts and 500 transactions per account
- Get it from the Microsoft Store
Find out more with GregsBudget on reddit
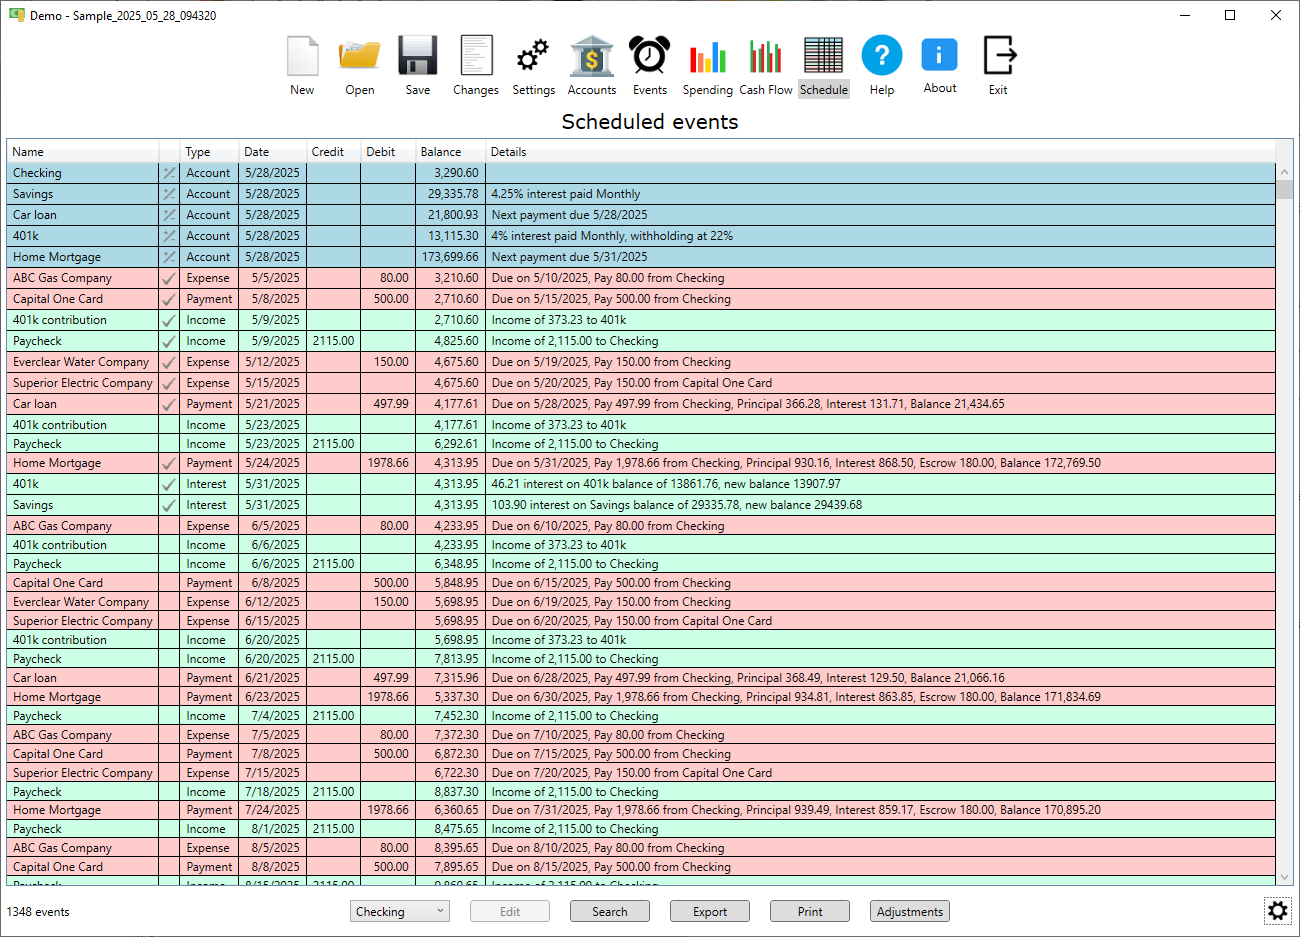
Schedule page
The schedule page is the default page that comes up when a budget file is loaded. This is where you can see what bills or other events are coming up and mark them complete as they are handled. It is also where you can see your account balance projected into the future based on the events you have entered. At the top of the schedule page is a list of accounts and current balances.
Here are some of the things you can do on the schedule page:
- Track the balance of any account by selecting it in the lower left drop-down list (Checking is tracked in the example below)
- Tracking a loan account allows you to see the loan balance dropping over time (like an amortization table)
- See when upcoming bills are due and when you have them scheduled for payment
- Click a check mark to pay a bill or complete an event
- Double click on an upcoming bill or other event to modify that instance by changing the amount, date or notes
- Click the "Adjustments" button to open the "Adjustments Window" and explore the "What-If" feature
- Print the schedule page (use "Microsoft Print to PDF" to save to a PDF file)
- Export the schedule to CSV or text
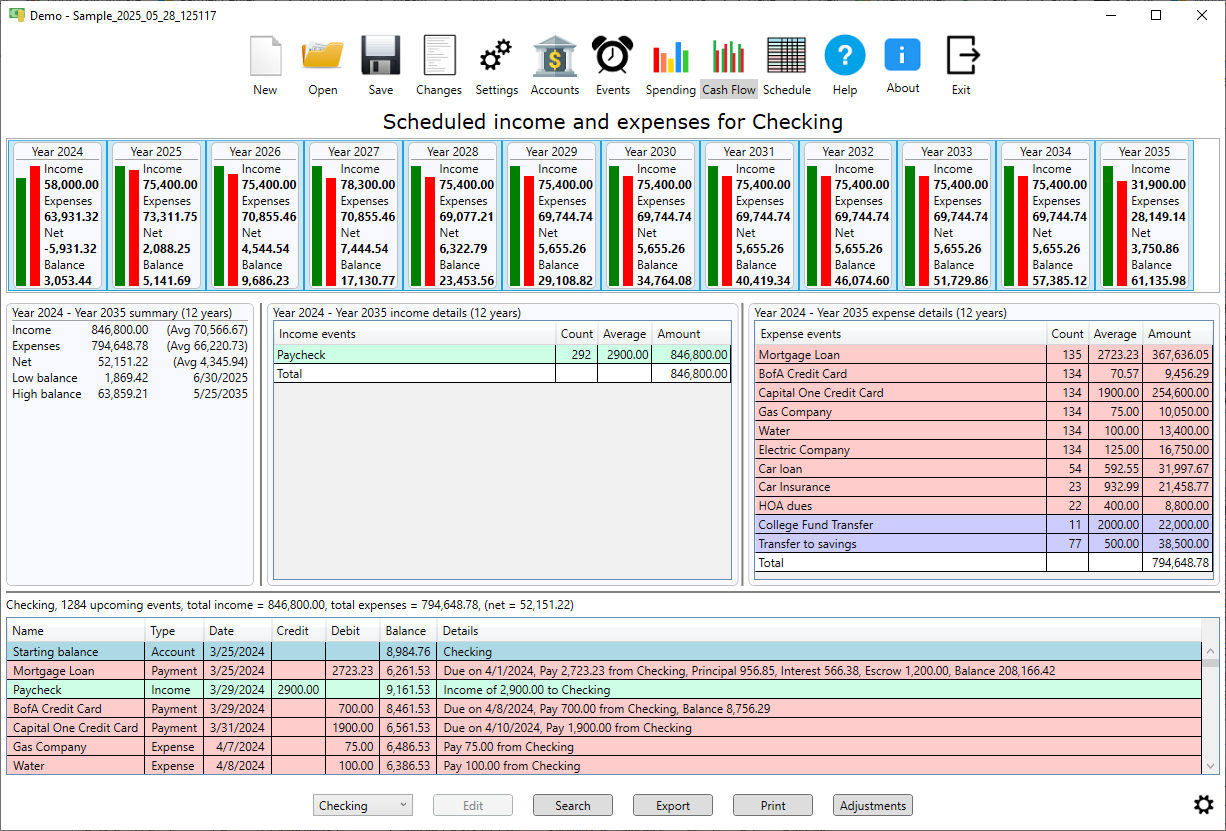
Cash flow page
The cash flow page is where you can see your future income and expenses for a single account in a chart view. At the top of the page is a horizontal list where income and expenses are partitioned into intervals with each interval showing a mini bar chart of income and expenses for that interval plus some statistics. Below that are columns for summary statistics, income events and expense events for the selected intervals. Any of the intervals, statistics or events can be selected to narrow the analysis.
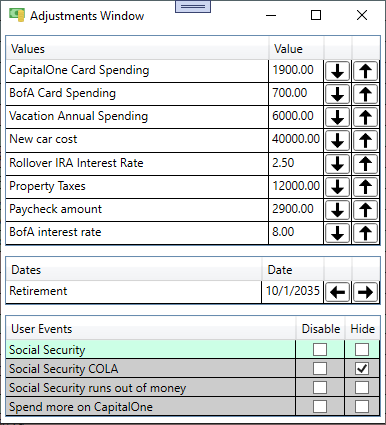
Adjustments
The "What-If" or "Adjustments" feature is accessed by opening the "Adjustments Window". Just click the "Adjustments" button on the schedule page or cash flow page. The "Adjustments Window" is where date and values that have been marked as adjustable can be adjusted by just clicking the arrows. Events that have been marked as adjustable will show up here also and can be disabled or hidden with a checkbox. The effect on the balances as these adjustments are made is immediately shown on the schedule.
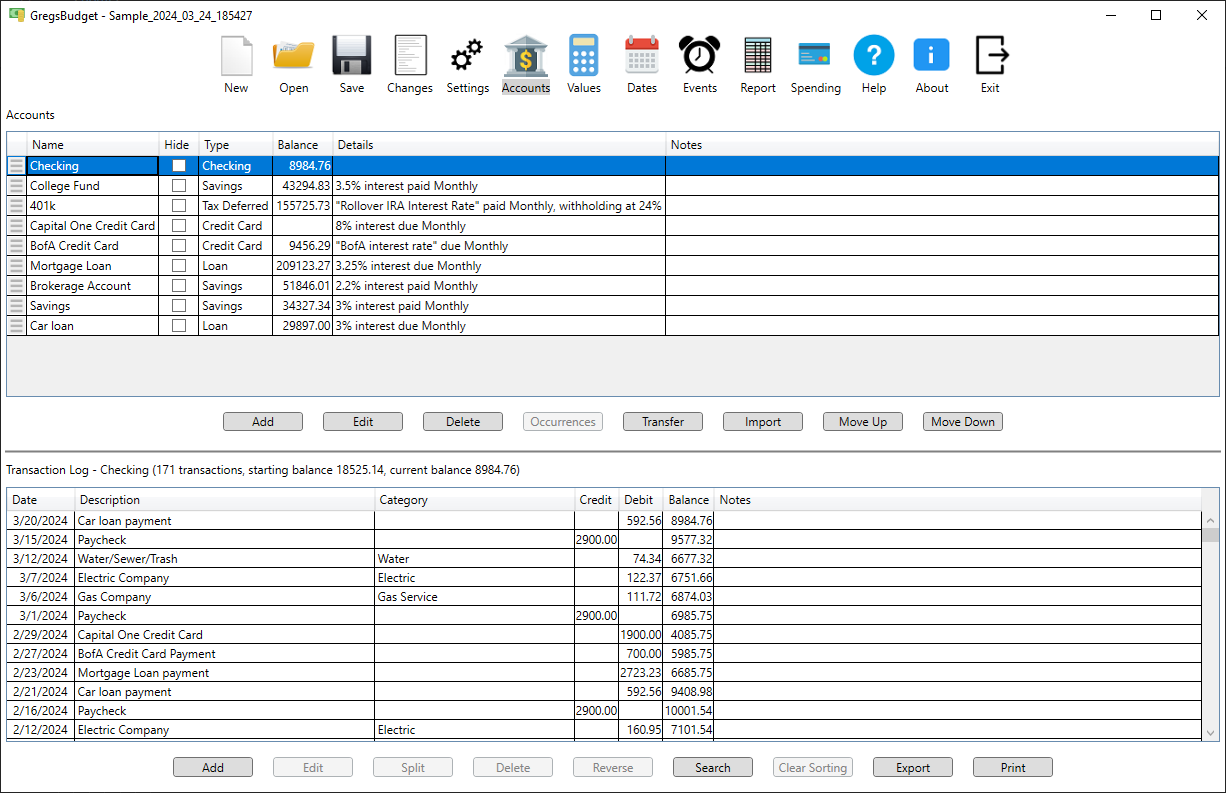
Accounts page
The accounts page shows the accounts in the upper half and transactions for the selected account in the lower half. Accounts can be cash, checking, savings, tax deferred, loan, credit cards or credit accounts. The three horizontal lines on the left of each account allows for dragging and dropping the accounts to reorder the list as do the "Move Up" or "Move Down" buttons. Both the accounts and transactions can be temporarily reordered by clicking on the column header.
Here are some of the things you can do with the accounts in the upper section:
- Select any account to show transactions for that account
- Add, edit or delete an account
- Edit payment occurrences for any loan account with the "Occurrences" button
- Transfer funds from one account to another with the "Transfer" button
- Import CSV data into the selected account with the "Import" button
Here are some of the things you can do with the transactions in the lower section:
- Add, edit, split, delete or reverse a transaction
- Search for transactions by description, date, amount, category and more with the "Search" button
- Export transactions to a CSV file using the "Export" button
- Print transactions using the "Print" button
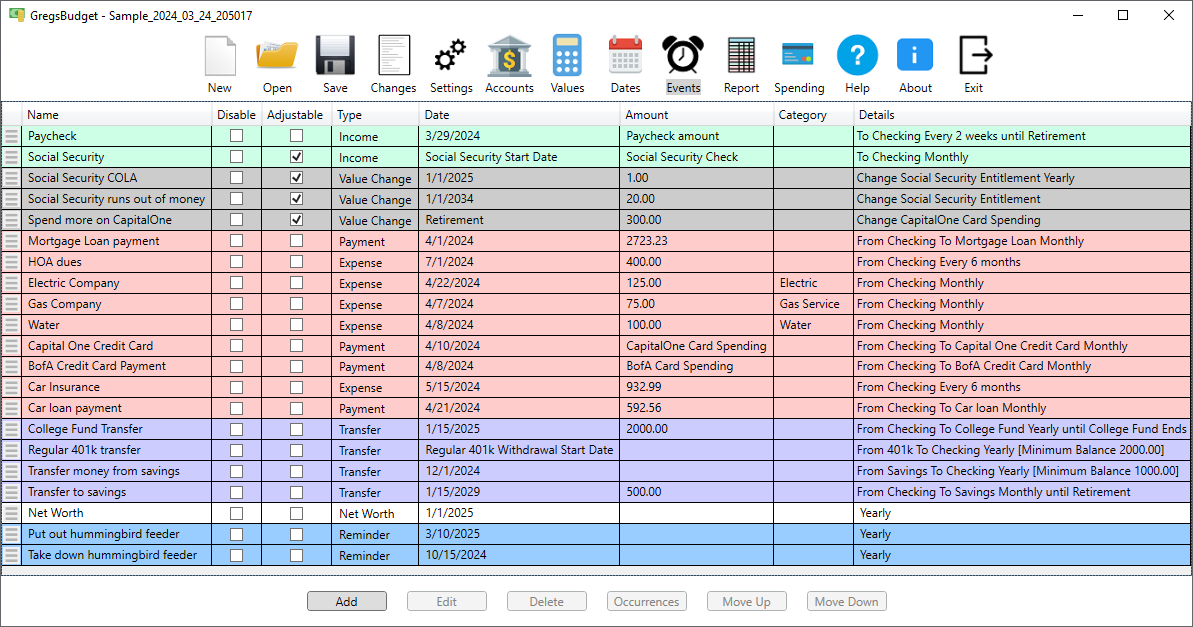
Events page
The events page shows the currently defined events. Events can be set for income, expenses, credit card payments, transfers, value changes or reminders. Each event can also be a repeating event or just a single occurrence. These events are processed into individual instances for display on the schedule page. Adjustable events can be disabled or enabled directly on the schedule page in the adjustments window allowing you to instantly see the effects on your account balances.
Here are some of the other things you can do with the events:
- Add, edit or delete an event
- Specify the periodicity of any repeating event with extensive options like certain days of the month, days of the week or months of the year
- Specify the duration of any repeating events by ending date or number of instances
- Select a category to be assigned to the transaction when the event triggers
- Create "smart transfers" where the amount of the transafer is calculated based on account balance at the time of the transfer
- Convert currencies when transferring funds between accounts using different currencies
- Automatically set aside money for taxes if transferring from a tax deferred account
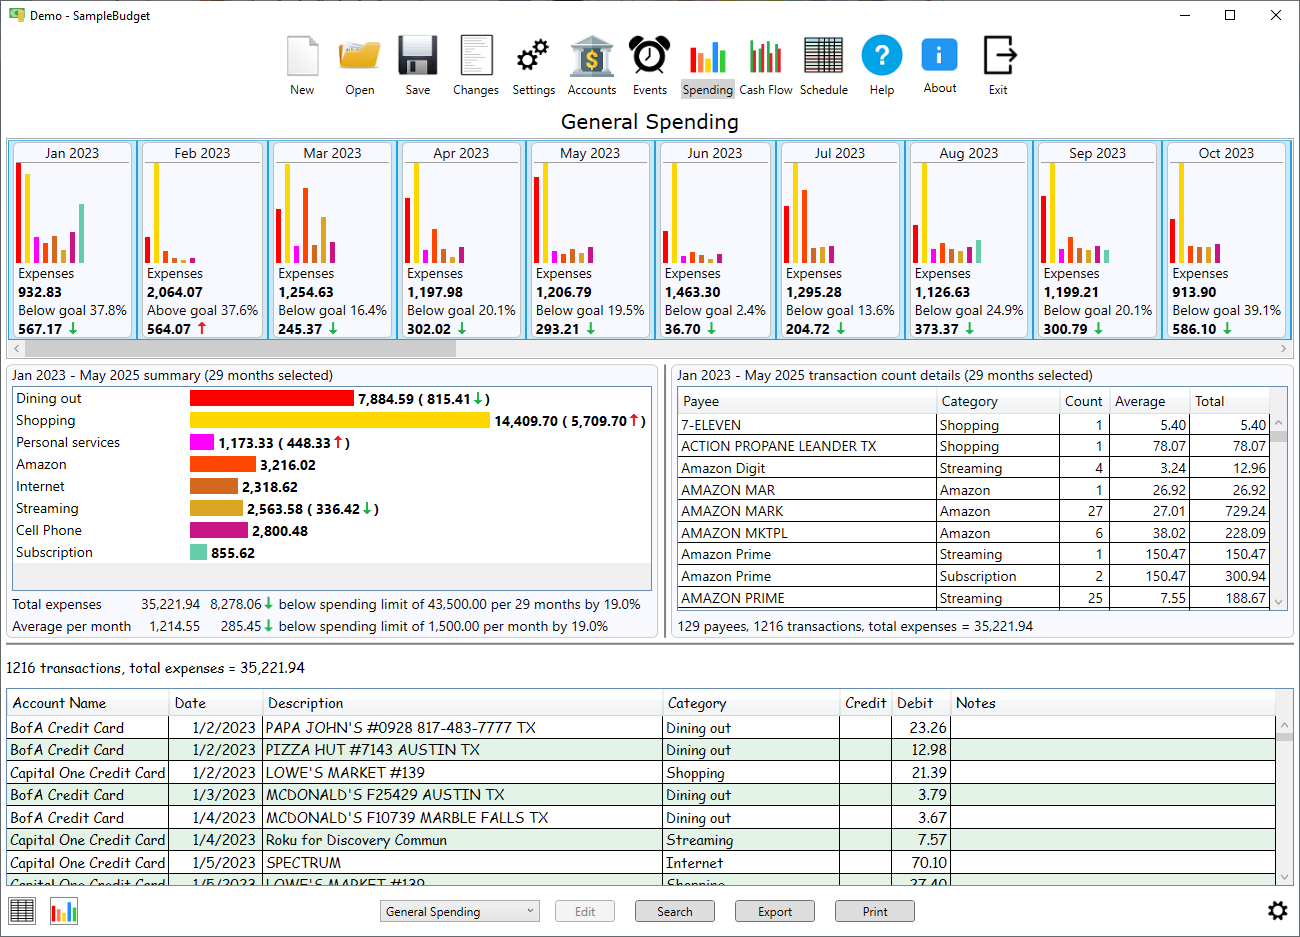
Spending page
The spending page shows past spending by category or spending group. It does this by analyzing transactions in each category. Creating categories and assigning them to transactions is necessary for this analysis. The easiest way to do this is to import the transactions. Each time you assign a category to a transaction it trains the software to predict how to automatically assign categories.
There are two ways to look at past spending. The spreadsheet view and the chart view. The spreadsheet view shows the spending in a grid where each row is a category and each column is a month. The chart view shows spending in with bar charts.
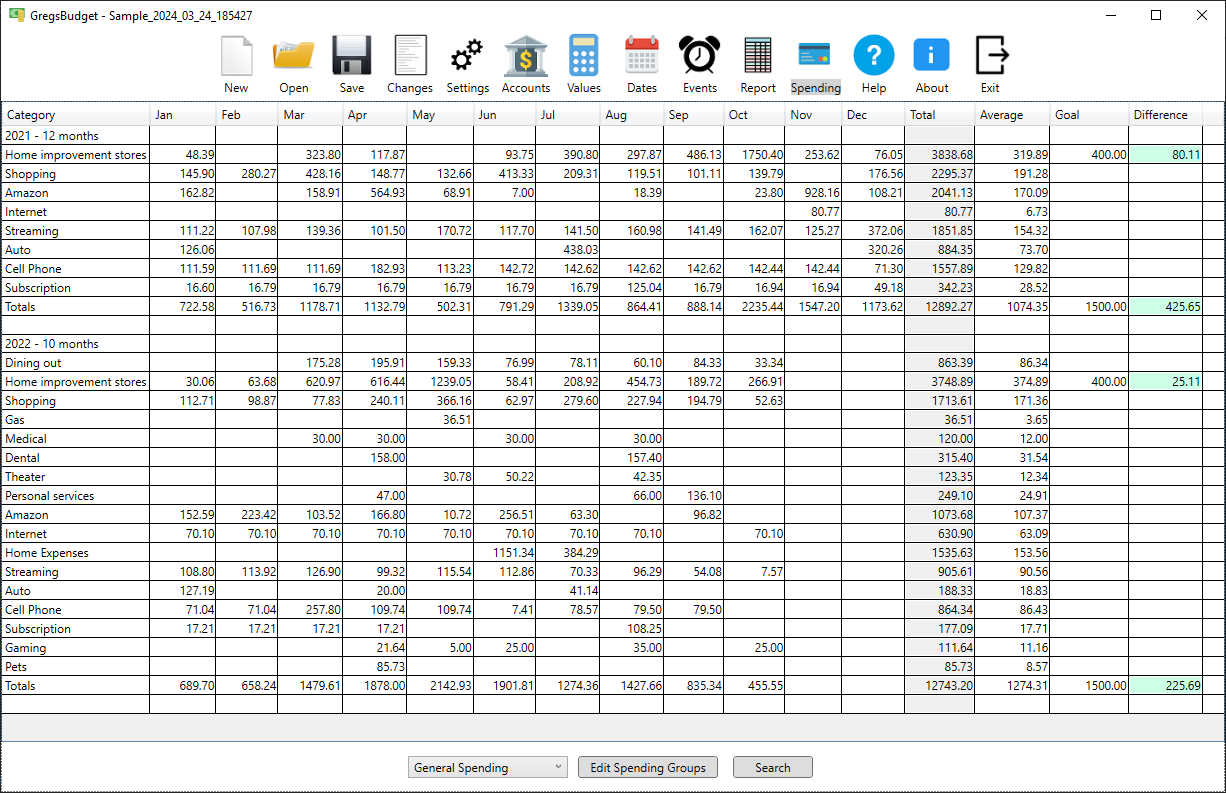
Spending page (spreadsheet view)
The spreadsheet view shows the spending in a grid where each row is a category and each column is a month. The grid is divided into sections where each section is a different year. On the right side of each section are columns with additional category stats. These include total for the year, monthly average, monthly spending goal (if defined for the category) and difference between average and goal. The last row in each section is a row for monthly totals across all the categories in that year. It also includes the total spending for the year, monthly average, monthly spending goal and difference columns. The monthly spending goal on the totals row is defined in the spending group.
Spending page (chart view)
Displays spending with bar charts. At the top of the page is a horizontal list of spending intervals. Each interval shows a mini bar chart of spending by category for that interval plus some statistics. Below that are summary statistics by category and payee. The associated transactions are shown at the bottom of the page. Any of the spending intervals, statistics or transactions can be selected to narrow the analysis.